Visualisation made with flourish.studio

The richest in society are having an outsized impact on the climate crisis. The flip side is that inclusive growth (the gains of which do not entirely go to the already-wealthy) is compatible with reducing our carbon emissions in line with the Paris agreement. In the UK, the average person in the top 1% emits 25 times more carbon dioxide equivalent (67 tons per year) than the average person in the bottom 10% (2.6 tons), and 13 times more than the average person in the bottom 50% (4.9 tons). These ratios are even more pronounced in countries like the US and China. Reductions in emissions in recent years have mostly been driven by reduced consumption by the bottom 50%. And the total emissions of the richest in society are equally important; figures from 2015 show that the top 1% in the UK contributed 7% of total emissions, while the bottom 50% contributed 30%. Recent global estimates, which include emissions from investments as well as consumption, suggest that the bottom 50% of the world population emitted 12% of global emissions in 2019, while the top 1% emitted 17% of the total. By 2030, the average per capita consumption emissions of the poorest 50% in the UK are set to fall to a level that is compatible with a 1.5°C rise in global temperatures (2.3 tons of CO2 per year), but the richest 10% will remain five times above it, and the richest 1% will remain 14 times above it.
Explore the context
Explore the arguments
Disadvantage undermines people’s capabilities and opportunities
 Disadvantage undermines people’s capabilities and opportunities

Many high earners are paid unreasonably large amounts of money
 Many high earners are paid unreasonably large amounts of money

People from poorer backgrounds are less likely to get to and do well at university
 People from poorer backgrounds are less likely to get to and do well at university

People from poorer backgrounds do less well at school
 People from poorer backgrounds do less well at school

Socio-economic inequality leads to environmental inequality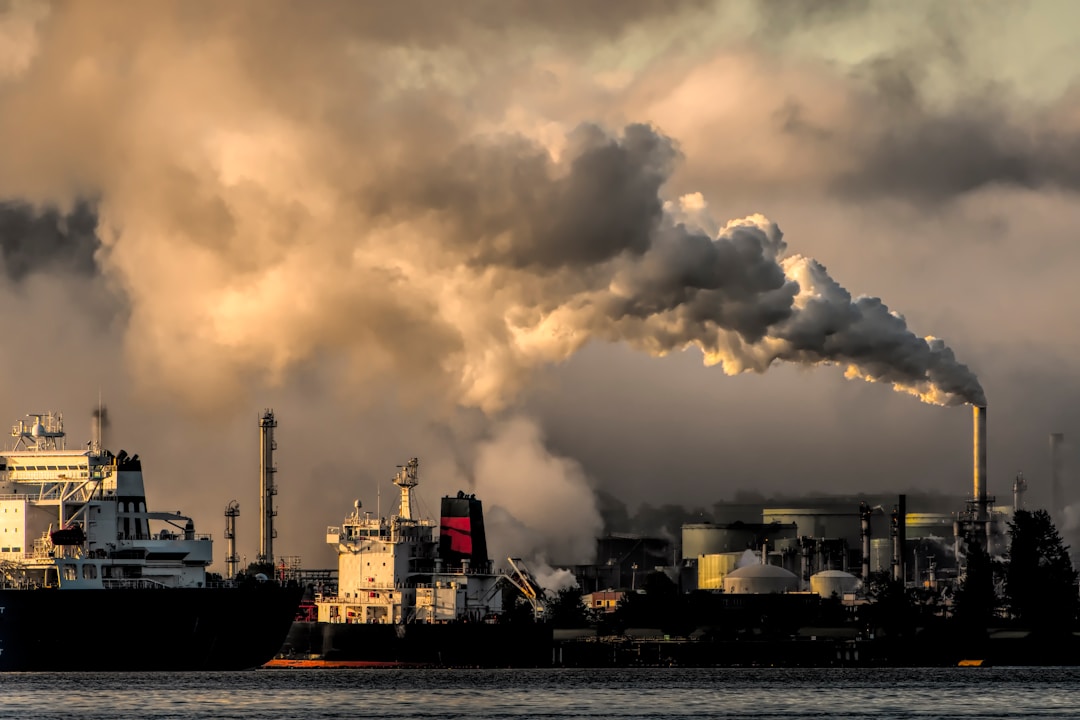
 Socio-economic inequality leads to environmental inequality

Socio-economic inequality leads to health inequalities
 Socio-economic inequality leads to health inequalities

Socio-economic inequality leads to more crime and less effective criminal justice
 Socio-economic inequality leads to more crime and less effective criminal justice

Socio-economic inequality leads to political inequality
 Socio-economic inequality leads to political inequality

The structure of our economy leads to huge regional inequalities
 The structure of our economy leads to huge regional inequalities

There is little relationship between merit and reward
 There is little relationship between merit and reward

Too many people are on low incomes and in insecure work
 Too many people are on low incomes and in insecure work

Wealth inequality is much larger than income inequality
 Wealth inequality is much larger than income inequality


