

Visualisation made with flourish.studio

Disadvantaged pupils who go on to further education are on average 4.5 grades behind their peers by the age of 19. Fewer disadvantaged pupils go onto higher education than their peers (29% of those who were on free school meals, compared to 50% of those who were not on free school meals). A higher proportion of female students than male students go onto higher education; white students are the least likely to go onto higher education, with the highest rates among Chinese, Asian and Black ethnic groups. Different types of university also have very different intakes, with higher proportions of disadvantaged students at less selective universities; students eligible for free school meals are 100 times less likely to go to Oxford or Cambridge universities than students from private schools. Disadvantaged pupils who get to university are less likely to get a good degree than their more privileged classmates.
Explore the context


Explore the arguments
Children with special needs are not well enough supported
 Children with special needs are not well enough supported
Genetic differences only play a small part in determining educational outcomes Genetic differences only play a small part in determining educational outcomes
High levels of inequality lead to low levels of social mobility High levels of inequality lead to low levels of social mobility
People from poorer backgrounds are less likely to get to and do well at university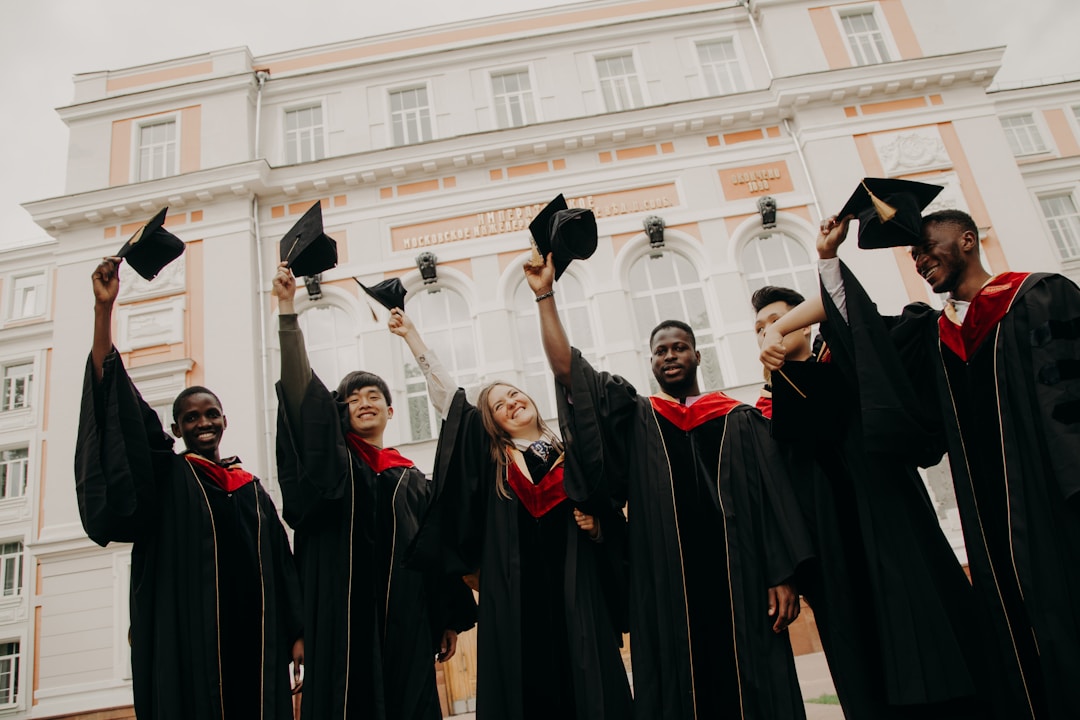 People from poorer backgrounds are less likely to get to and do well at university
People from poorer backgrounds do less well at school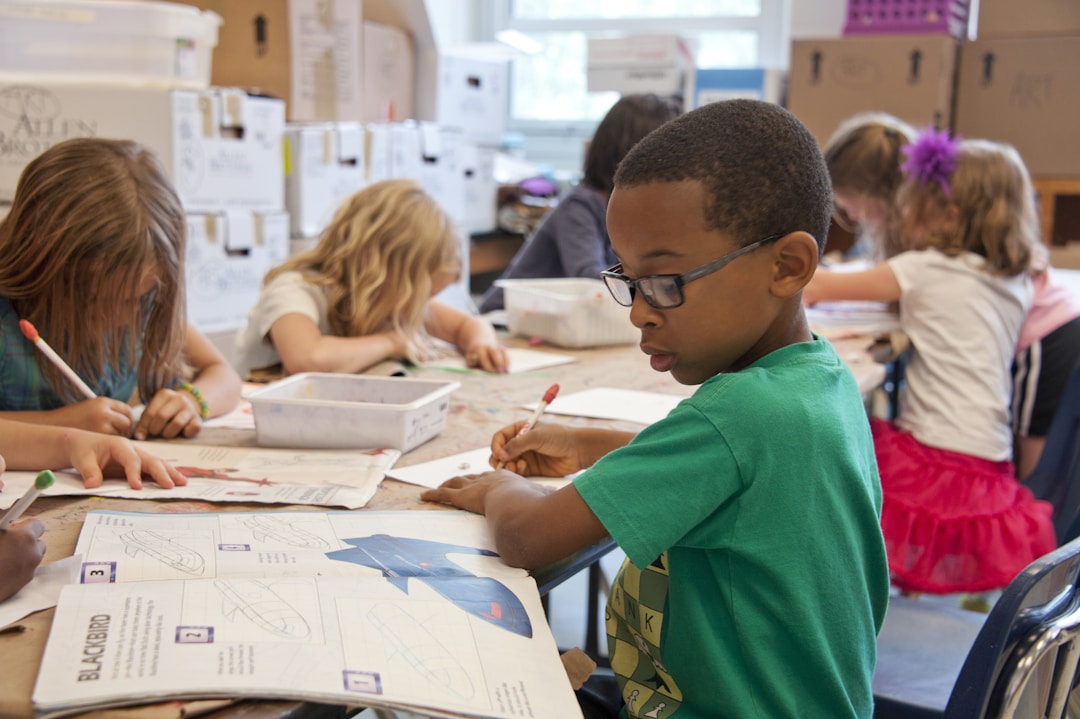 People from poorer backgrounds do less well at school
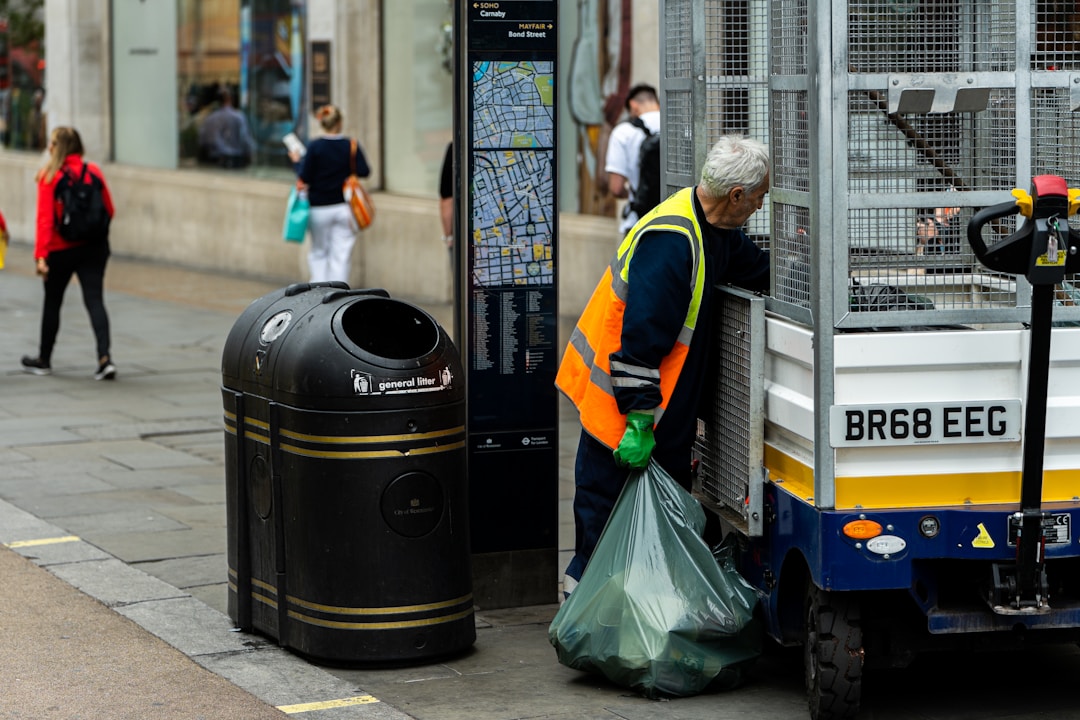
Poor quality work undermines people’s physical and mental health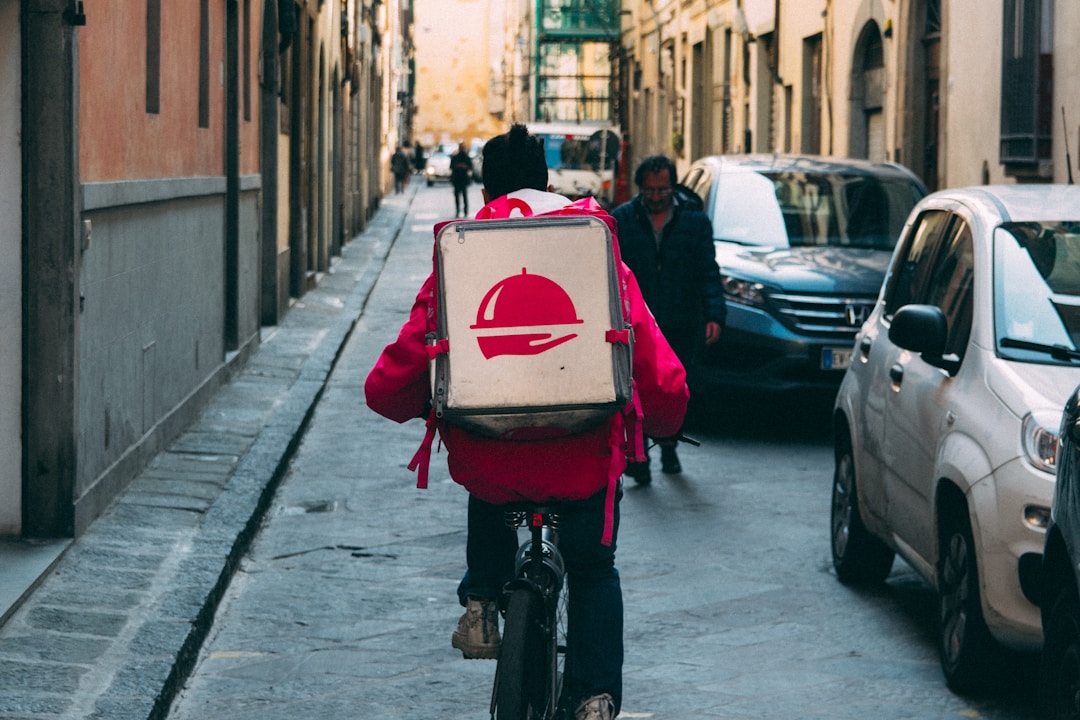 Poor quality work undermines people’s physical and mental health
Poorer people don’t have a buffer against economic shocks Poorer people don’t have a buffer against economic shocks
Socio-economic inequality leads to environmental inequality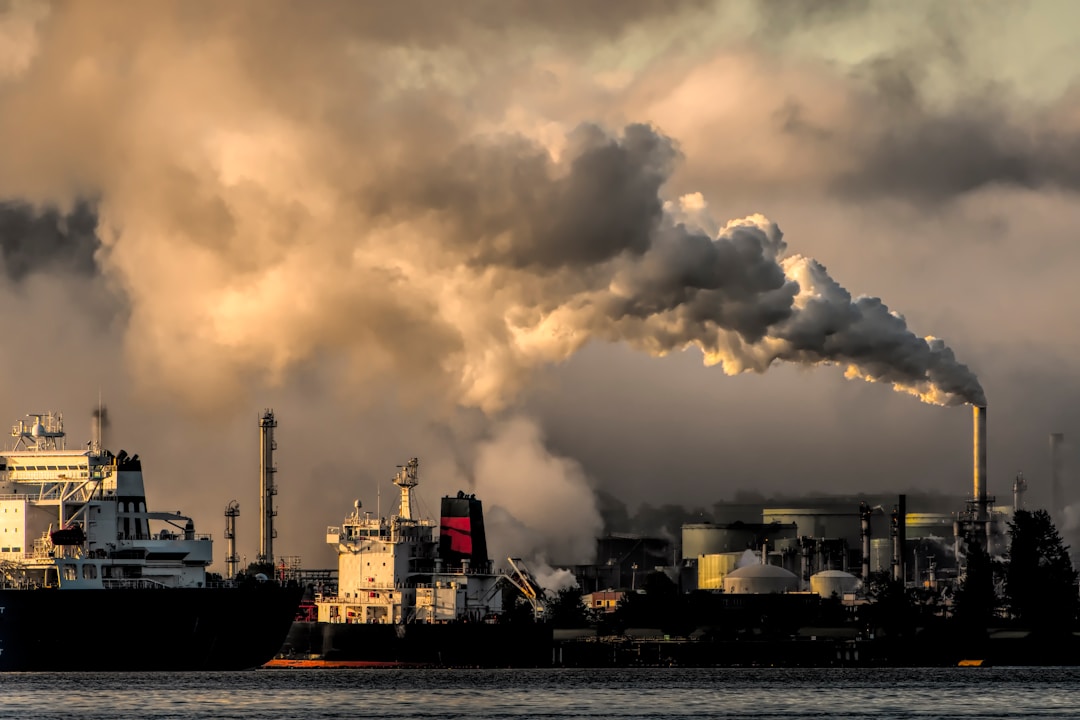 Socio-economic inequality leads to environmental inequality
Socio-economic inequality leads to health inequalities Socio-economic inequality leads to health inequalities
Socio-economic inequality leads to more crime and less effective criminal justice Socio-economic inequality leads to more crime and less effective criminal justice
Socio-economic inequality leads to political inequality Socio-economic inequality leads to political inequality
The education system can never totally compensate for disadvantage The education system can never totally compensate for disadvantage
The structure of our economy leads to huge regional inequalities The structure of our economy leads to huge regional inequalities
There is little relationship between merit and reward There is little relationship between merit and reward
Too many people are on low incomes and in insecure work Too many people are on low incomes and in insecure work
Wealth inequality is much larger than income inequality Wealth inequality is much larger than income inequality


